Document Actions
Photonic Pathology
Photonic Structural and Chemometric Pathology (PSCP)
Currently histopathology is the golden standard for cancer diagnosis and prognosis which mainly utilizes the degree of loss of the normal glandular tissue architecture (i.e., shape, size and differentiation of the glands). It, however, is subjective and suffers from many drawbacks including requirement for lengthy tissue processing, cost, interobserver as well as intraobserver variations, and difficulty to stratify cancer aggressiveness. We are developing Photonic Structural and Chemometric Pathology (PSCP) - a novel cost effective label-free quantitative phase and autofluorescence microscopy for cancer diagnosis and prognosis[1, 2]. PSCP can operate directly on unstained fresh or frozen sections and hence avoids time-consuming tissue processing required for conventional histopathology. Computational staining by PSCP can highlight molecular contrast "better" than H&E staining, reflecting quantitatively chromophore concentrations. PSCP also utilizes alternate clues including alterations in the microenvironment, scattering characteristics, and cellular metabolism to generate an objective risk score for cancer diagnosis. Our results on prostate cancer suggested PSCP is promising in not only grading cancer but also predicting patient outcome, potentially achieving much higher accuracy than the standard histopathology [2].
Our QPM system is based on differential interference phase contrast (DIC) microscope and quantitative phase maps are computed with the transport of intensity equation (TIE). Accurate two-dimensinal (2D) optical property maps (scattering, reduced scattering, and anisotropy factor) are then generated via the scattering-phase theorem [1] which are then used for pathological analysis.
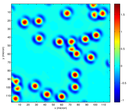
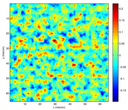
Figure 1: The optical path length map ΔOPL for a monolayer of polystyrene sphere suspension (size: 8.31μm) in water (left) and a thin film (thickness: 4μm) of Intralipid-20% suspension (right).
|
Polystyrene Spheres
|
Intralipid-20%
|
|||||
| Csca(μm2) | C sca′(μm2) | g | μ s(μm-1) | μ s’(μm-1) | g | |
|
|
|
|
|
|
|
|
| Theoretical | 125 | 9.5 | 0.92 | 0.139 | 0.031 | 0.78 |
| Measurement | 118 | 10.2 | 0.91 | 0.136 | 0.022 | 0.84 |
Table 1: Comparison between the theoretical scattering properties for polystyrene spheres and Intralipid-20% suspension with their measured values at the probing wavelength 550nm.
Typical resolved chromophore concentration maps from chemometric microscopy are shown in Figure 2 for normal (top row), perilesional (middle row), and cancerous (bottom row) lung tissue. The average concentrations of tryptophan, elastin, NADH and FAD exhibit the overall monotonous decrease from normal, perilesional to cancerous tissue (Trp: 61.7mM, 40.6mM, and 22.8mM; elastin: 15.2mM, 13.7mM, and 4.2mM; NADH: 0.23mM, 0.22mM, and 0.19mM; and FAD: 0.47mM, 0.35mM, and 0.19mM for normal, perilesional, and cancerous lung tissue, respectively). The corresponding average concentration ratio is 0.0065, 0.0085, to 0.0053 for FAD/Trp and 2.00, 1.52 to 0.98 for FAD/NADH, respectively. The first column of Fig. 2 shows the corresponding H&E stained image from a different serial cut section of the same site. Note the nuclei do not contain elastin, NADH or FAD, evident in their corresponding concentration maps. The mitochondria are associated with elevated concentrations of NADH and FAD. The perilesional case is particularly clear showing the abundance of mitochondria in NADH, FAD, and FAD/Trp maps.
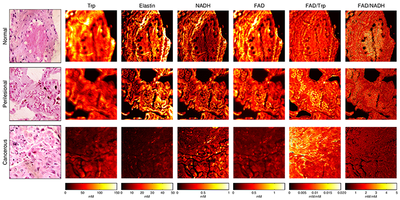
Figure 2: The chemometric microscopic images for typical normal (top row), perilesional (middle row), and cancerous (bottom row) lung tissue. The first column shows the corresponding H&E stained image from a different serial cut section of the same site. The rest columns from left to right are the concentrations (mM) of tryptophan, Elastin, NADH, FAD, and the concentration ratios of FAD/Trp and FAD/NADH, respectively. The window size is 160μm × 160μm.
For better visualization, the extracted maps for different fluorophore species may be combined to yield a computationally stained image by color coding the fluorophore species. Fig. 3 displays the computationally stained images for the normal, perilesional, and cancerous sites from the fluorophore concentration maps shown in Fig. 2. The fluorophore species Trp, elastin, NADH, and FAD are color coded as gray, green, blue and red with their intensities proportional to the concentration, respectively. Comparing to the conventional stained images, the computationally stained images exhibit distinctive advantages in highlighting the biochemical contrast between normal, perilesional, and cancerous sites. For example, the computationally stained images in Fig. 3 clearly show the abundance of Try and elastin in the normal site and the shifting of the redox ratio, in particular over the mitochondria, between the perilesional and cancerous sites. The mitochondria are violet in the perilesional site and become blue in the cancerous site with the reduction in the redox ratio FAD/NADH.
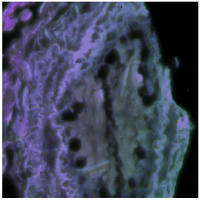
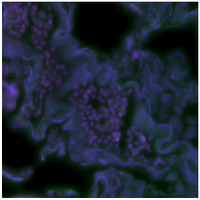
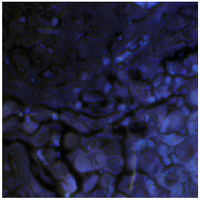
Figure 3: The computationally stained images for the normal, perilesional, and cancerous sites from the fluorophore concentration maps shown in Fig. 2. The fluorophore species Trp, elastin, NADH, and FAD are color coded as gray, green, blue and red with their intensities proportional to the concentration, respectively.
The discriminating power of the relative fluorescence strength is much weaker than that of the absolute fluorescence strength as achieved by chemometric microscopy. Indeed, the absolute concentrations can be used to classify non-cancer (perilesional and normal, n = 66) vs cancer (n = 52) much more accurately than the relative fluorescence strength. The ROC curves computed using SVM with 5-fold cross-validation were shown in Fig. 4 in which the accuracy of the classification is 99.8% for the former and 93.9% for the latter. The accuracy with the redox ratios alone is 77.1%.
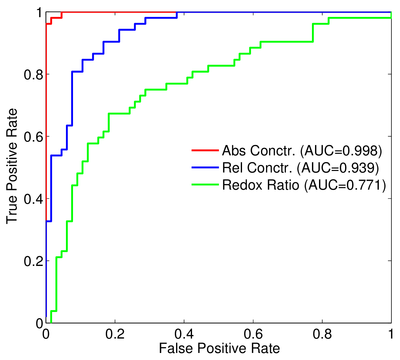
Figure 4: The discrimination power of the absolute concentrations is much stronger than that of relative fluorescence strength and redox ratios. The ROC curves were computed using SVM with 5-fold cross-validation for classification of non-cancer (perilesional plus normal) vs cancer.
On-going research projects:
Current projects aim to investigate deep learning to further improve the diagnostic accuracy of PSCP and uncover Physics laws governing cancer cell growth from PSCP microscopy data.
Selected Publications
[1] Min Xu. The scattering-phase theorem: anomalous diffraction by forward-peaked scattering media. Opt. Express, 19:21643-21651, 2011.
[2] Zhang Xu, Michael Reilley, Run Li, and Min Xu. Mapping absolute tissue endogenous fluorophore concentrations with chemometric wide-field fluorescence microscopy. J. Biomed. Opt., 22(6):066009, jun 2017.