- Info
Committee Letter Recipient Data
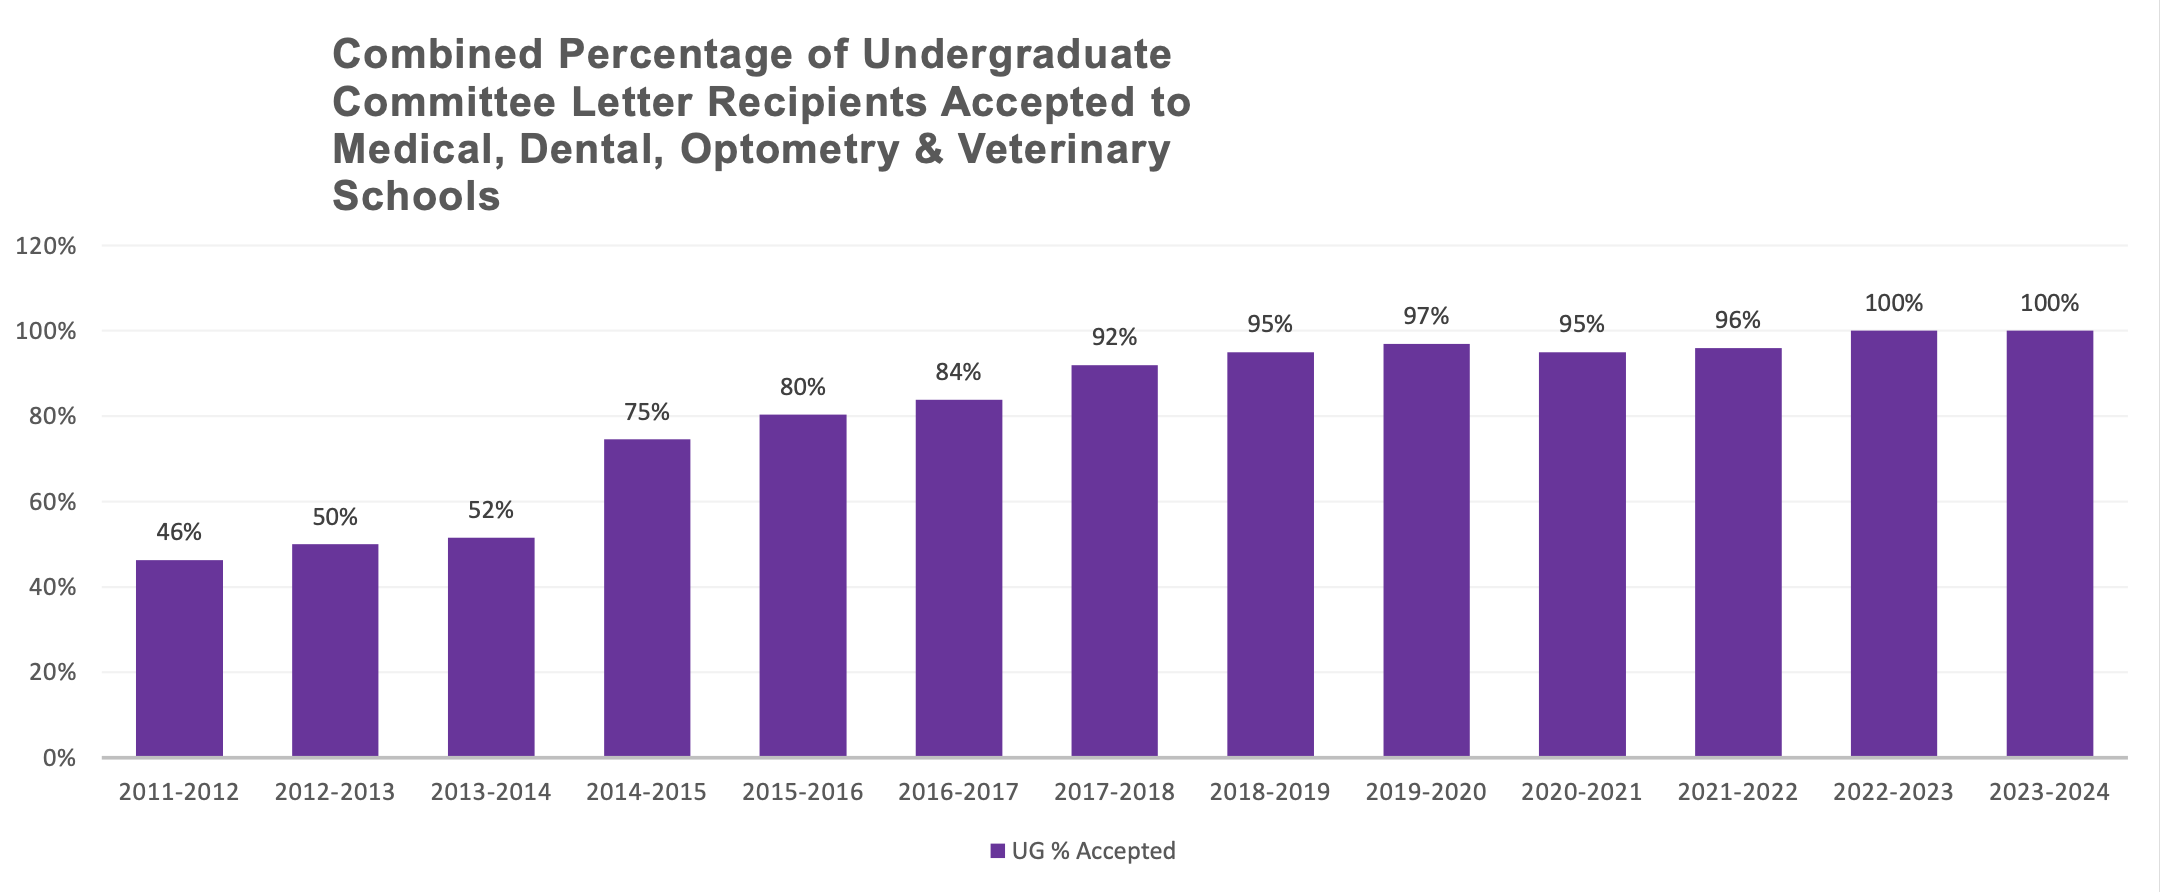
Rate of Acceptance to Health Professions Programs for Committee Letter Recipients
2023-2024 Applicant Data
| School | Medical | Dental | Optometry |
| Applied |
44 |
8 |
1 |
| Accepted |
44 |
8 |
1 |
| % Accepted |
100 |
100 |
100 |
2022-2023 Applicant Data
| School | Medical | Dental | Optometry | Veterinary |
| Applied |
34 |
5 |
3 |
0 |
| Accepted |
34 |
5 |
3 |
0 |
| % Accepted |
100 |
100 |
100 |
|
2021-2022 Applicant Data
| School | Medical | Dental | Optometry | Veterinary |
| Applied |
40 |
3 |
2 |
0 |
| Accepted |
38 |
3 |
2 |
0 |
| % Accepted |
95 |
100 |
100 |
|
2020-2021 Applicant Data
| School | Medical | Dental | Optometry | Veterinary |
| Applied |
40 |
4 |
2 |
0 |
| Accepted |
37 |
4 |
2 |
0 |
| % Accepted |
93 |
100 |
100 |
|
2019-2020 Applicant Data
| School | Medical | Dental | Optometry | Veterinary |
| Applied |
59 |
6 |
0 |
0 |
| Accepted |
57 |
6 |
0 |
0 |
| % Accepted |
97 |
100 |
|
|
2018-2019 Applicant Data
| School | Medical | Dental | Optometry | Veterinary |
| Applied |
43 |
11 |
0 |
1 |
| Accepted |
40 |
11 |
0 |
1 |
| % Accepted |
93 |
100 |
|
100 |
2017-2018 Applicant Data
| School | Medical | Dental | Optometry | Veterinary |
| Applied |
54 |
6 |
0 |
0 |
| Accepted |
49 |
6 |
0 |
0 |
| % Accepted |
91 |
100 |
|
|
2016-2017 Applicant Data
| School | Medical | Dental | Optometry | Veterinary |
| Applied |
46 |
6 |
3 |
1 |
| Accepted |
38 |
5 |
3 |
1 |
| % Accepted |
83 |
83 |
100 |
100 |
2015-2016 Applicant Data
| School | Medical | Dental | Optometry | Veterinary |
| Applied |
75 |
11 |
1 |
0 |
| Accepted |
60 |
10 |
1 |
0 |
| % Accepted |
80 |
90 |
100 |
|
Medical School Acceptances
| Application Year | Allopathic | Osteopathic |
| 2015-2016 |
53 |
17 |
| 2016-2017 |
31 |
7 |
| 2017-2018 |
38 |
11 |
| 2018-2019 |
33 |
7 |
| 2019-2020 |
40 |
17 |
| 2020-2021 |
27 |
11 |
| 2021-2022 |
34 |
4 |
| 2022-2023 |
31 |
3 |